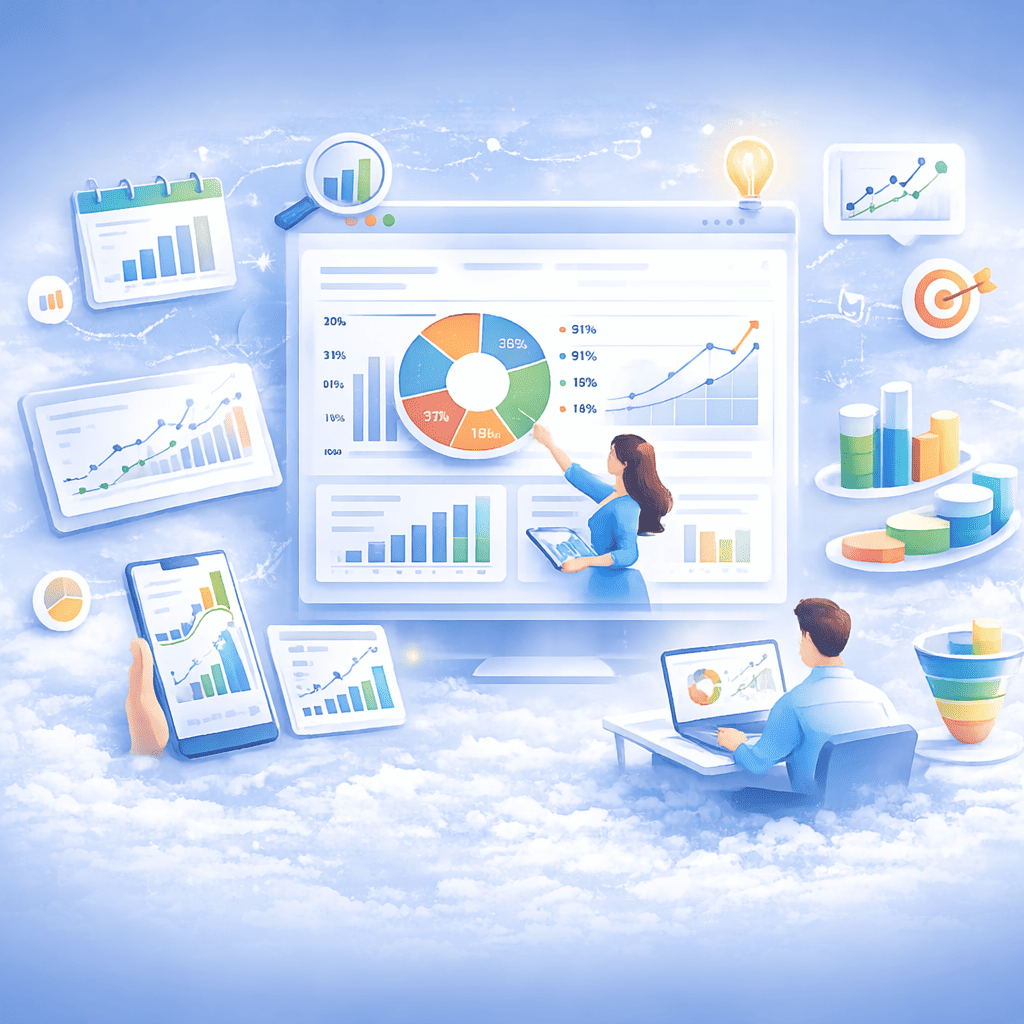
We transform raw data into visual dashboards and reports that help you understand performance, spot trends, and make smarter business decisions faster.
Data visualization turns complex data into simple charts and dashboards that make performance easy to understand at a glance.
It helps businesses spot trends, measure results, and make faster, smarter decisions without dealing with spreadsheets.
Key benefits:
We provide a comprehensive range of Data Visualization Services tailored for businesses of all sizes and platforms.
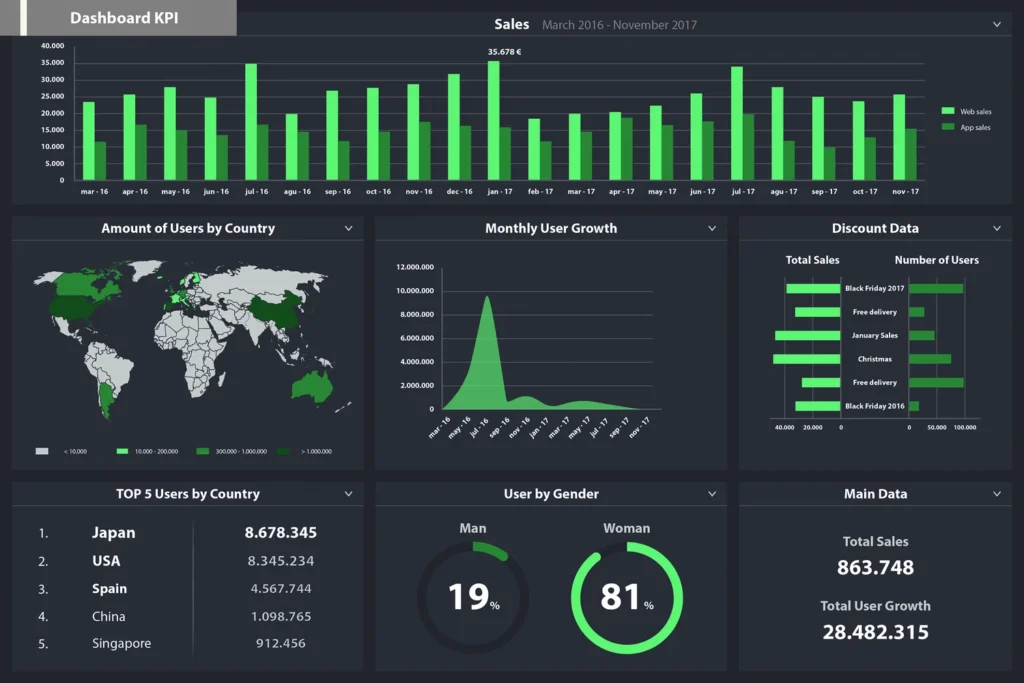
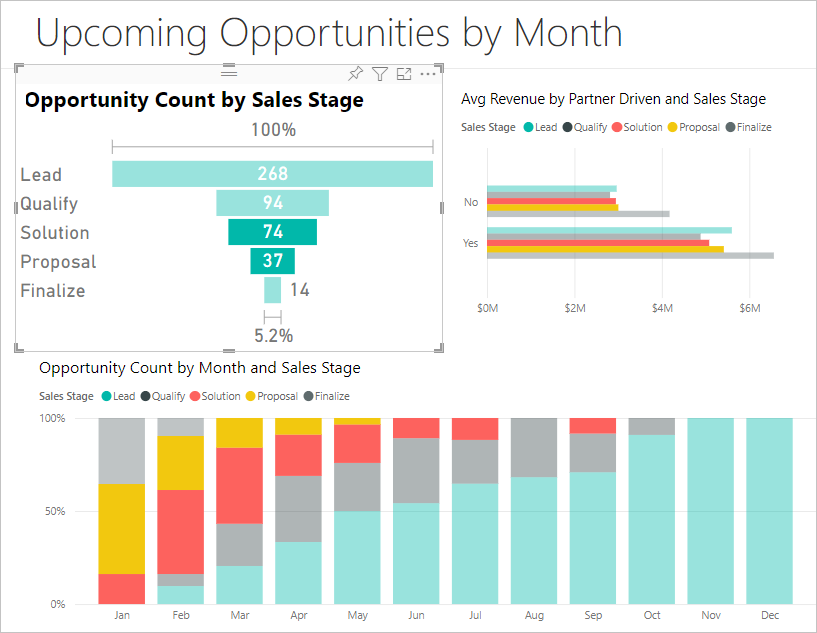
We design dashboards tailored to your goals, showing KPIs, trends, and performance metrics in one clear view.
Visualize ad performance across platforms like Google, Meta, and TikTok to understand ROI and optimize spend.
Track live data updates so you can react quickly to changes in performance or user behavior.
See how users move through your funnel and identify where drop-offs or opportunities exist.
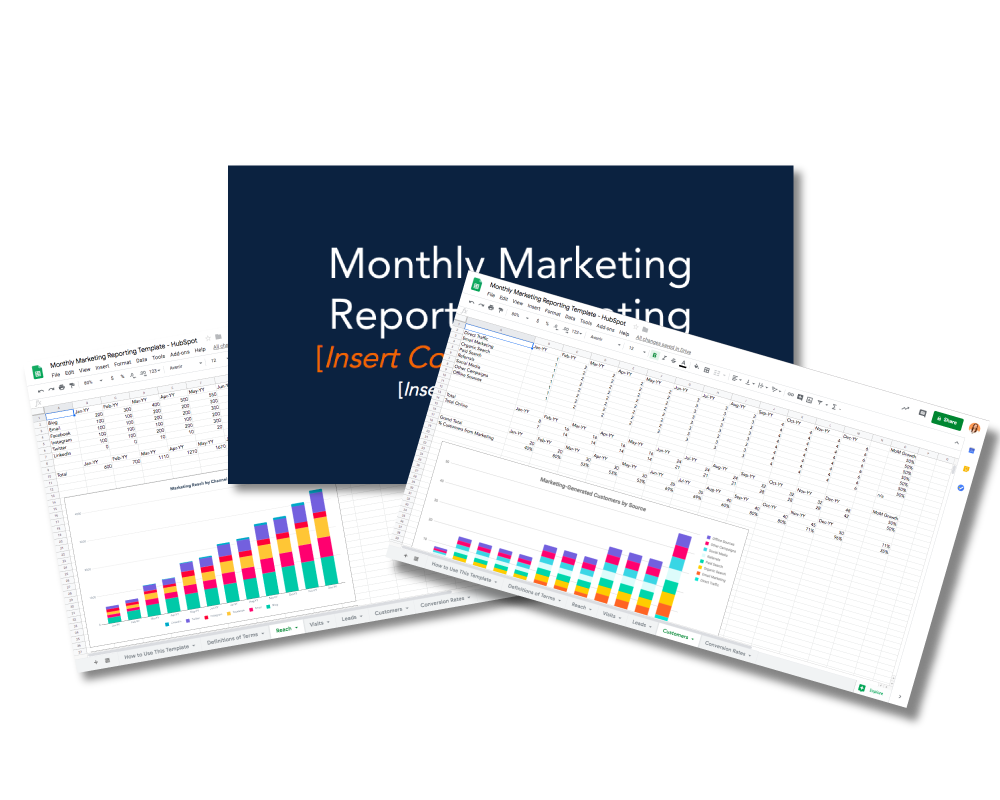
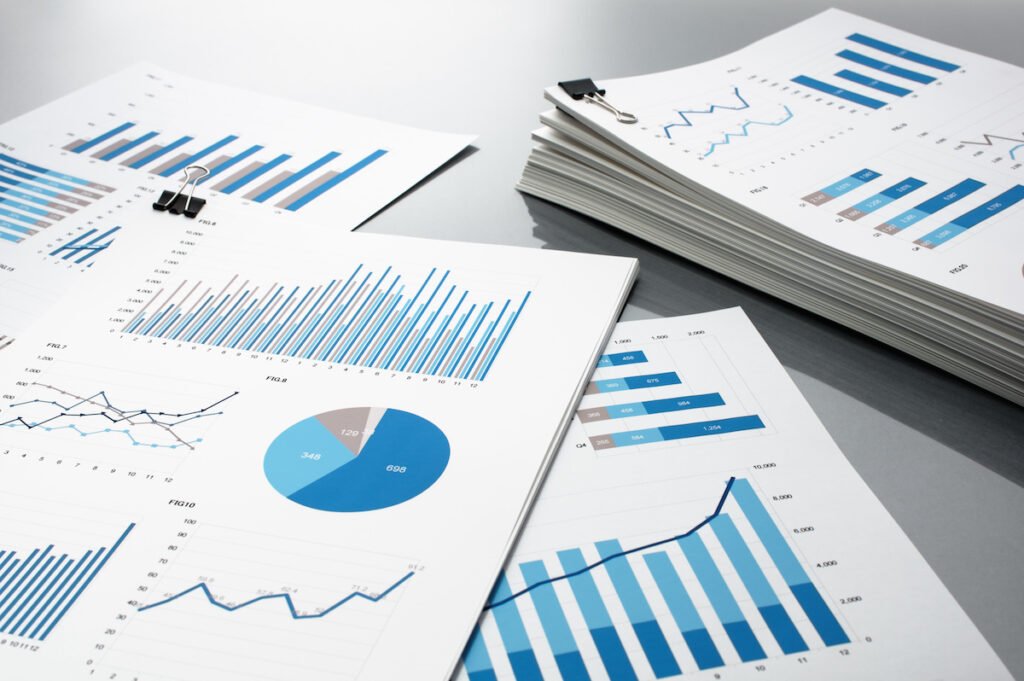
Clean, professional reports designed for presentations, stakeholders, and client sharing.
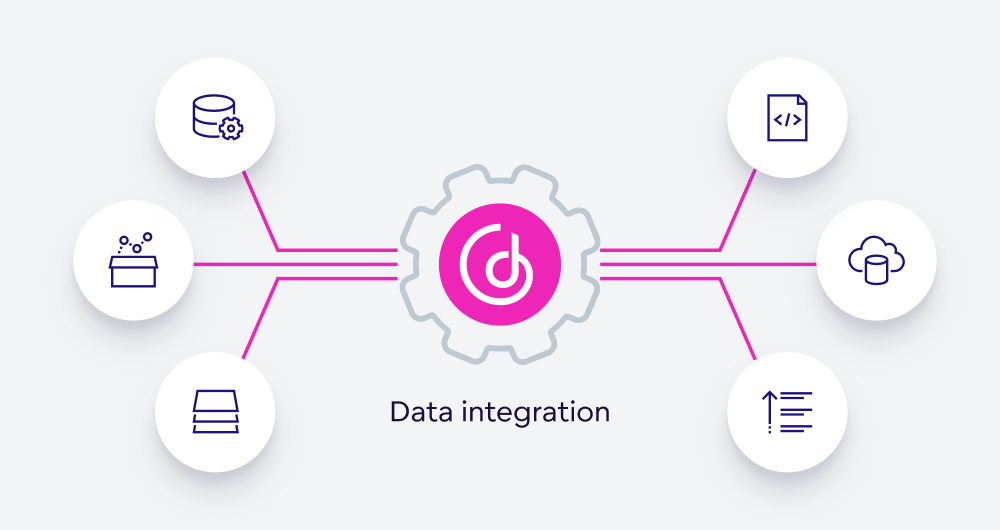
We combine data from multiple platforms into a single visual dashboard, giving you a complete view of performance without switching between tools.
See why brands choose Conversion Tracking Experts for precise, reliable conversion tracking across every platform.
We focus on clarity and insights, not flashy charts.
Every dashboard is tailored — no generic templates.
Your team can read and use the data without training.
Dashboards evolve as your data and goals expand.
We visualize marketing, sales, website, and conversion data. If your data exists, we can turn it into clear and meaningful visuals.
In most cases, no. Dashboards replace manual reporting and give you real-time insights without digging through spreadsheets.
Yes. Every dashboard is fully customized based on your goals, KPIs, and the metrics that matter to you.
Data can be updated in real time or on a scheduled basis, depending on your needs and data sources.
Not at all. Dashboards are designed to be simple, visual, and easy to understand for anyone on your team.
We Conversion Tracking Experts alaways uses the optimal tools to scale your marketing performance